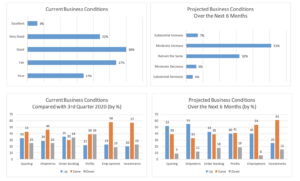
NTMA offers many valuable resources to members, including annual and bi-annual industry benchmarking reports for executive compensation, wages and fringe benefits, operating costs, and business conditions.
Machine shop owners can use these reports to realistically compare wage rates, overhead costs, financial ratios, and so much more to set realistic and attainable goals in the years ahead. The reports are industry- and size-specific, focusing exclusively on small to medium size precision manufacturing businesses across the United States.

What’s the Value of Benchmarking?
In any business, the goal is always to grow and improve. But without adequate benchmarking data, there’s the risk of setting goals or standards that simply aren’t realistic for yourcompany. The data in these reports provides immense value to modern CNC machine shop owners.
NTMA’s benchmarking reports are broken down by:
- State
- Region
- Size
- Sector
This segmented information allows precision manufacturers to view average and best-in-class numbers among their competitors so they can set appropriate targets and give precise directives to employees.
Shop owners around the country use these reports to their benefit. “I use all the information to help guide me regarding operating results, matters of wages, and standing within the industry. As a company which strives to be an employer of choice in the marketplace, this information is so beneficial,” said Rich Benward, President of Hubbs Machine & Manufacturing, Inc.
What to Expect from NTMA’s Industry Benchmarking Reports
If you’re already an established NTMA member, you know that there are many tools at your disposal to improve your business. Peer-to-peer networking, for example, is an excellent opportunity to share and absorb new knowledge, resources, and solutions.
Collaborative interaction with like-minded peers is indeed a big component of learning and growing this type of business, but it’s no substitute for the level of detail and statistical analysis that goes into the benchmarking reports available through NTMA. This information is also impossible to find online—especially at such a precise level of detail.
In NTMA’s reports, you can find anything from “the average hourly rate for level 1 CNC machinists at machine shops that make less than $2 million in annual sales” to the annual return on investment for businesses in different sectors of precision manufacturing.
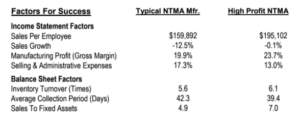
We even break the figures down into different performance levels: typical manufacturers and high-performing manufacturers. This additional segmentation allows you to benchmark your shop against average and best-in-class figures and set the bar high for future growth.

It’s possible to grow and improve a modern CNC machine shop without this data, but the question is why would you? Our industry benchmarking reports will help you identify potential inefficiencies and opportunities so you can justify internal actions like cutting down on direct labor expenses and external actions like securing a loan for a new piece of equipment. The possibilities are endless.
View our full list of benchmarking reports on our website and don’t miss our latest Operating Cost Report, which we just released on July 30, 2021.


